>> ABSOLUTELY. >>’S QUESTION FROM -- NEXT QUESTION FROM WLWT. >> HOW ARE YOU DOING TODAY? GOOD. WE ARE STILL WITHOUT ANY STATE CLEARINGHOUSE FOR VACCINE SIGN-UPS. WE KEEP HEARING FROM PEOPLE BOUNCING BETWEEN WEBSITES TO WEBSITES TRYING TO GET A VACCINE APPOINTMENT. ARE THE REDESIGNS COMING? IS THERE A FIRM TIMELINE FOR FIXING THIS AND WHAT HOPE OR HELP CAN YOU OFFER THOUSANDS OF PEOPLE STILL STRUGGLING TO GET THROUGH THE CURRENT SYSTEM WE ARE WORKING WITH? GOV. DEWINE: THE MOST HELP WE CAN GIVE THEM IF WE GOT MORE VACCINE. I JUST TALKED ABOUT WHEN WE WILL HOPEFULLY GET MORE VACCINE. THAT IS THE ROOT OF MOST OF THESE CHALLENGES, BASICALLY NOT ENOUGH VACCINE. VALENTINE’S DAY FOR THEIR ABOUT IS THE DAY WE HOPE TO START THIS PROCESS AND WE WOULD ENCOURAGE PROVIDERS TO JOIN THE SYSTEM. PROVIDERS HAVE TO SIGN UP AND THERE WILL BE A DAY IN THE NEXT FEW DAYS WHEN WE WILL GIVE THEM NOTICE THEY CAN GO IN AND SIGN UP. WHAT WE WOULD HOPE IS A SEAMLESS EXPERIENCE WHERE SOMEONE CAN GO ON ONLINE, PUT IN THEIR ZIP CODE, PUT IN THEIR COUNTY AND COME UP WITH PLACES THAT HAVE BEEN INCORPORATED INTO THAT SYSTEM. IT WILL TELL YOU WHICH ONES HAVE VACCINE AVAILABLE. YOU CAN GO INTO THAT AND DIRECTLY MAKE AN APPOINTMENT RIGHT THERE. MY UNDERSTANDING WITH THE HOSPITALS, THE HOSPITALS HAVE THEIR OWN SYSTEM AND DON’T WANT TO LINK INDIRECTLY, BUT AGAIN, THAT WILL BE SOMETHING YOU CAN STILL NAVIGATE FROM THE PORTAL WE ARE GOING TO ESTABLISH AND THEN GOING INTO THEIR SYSTEM AND REGISTER THROUGH THEIR SYSTEM. IT WILL BE IN IMPROVEMENT. IT STILL DOES NOT SOLVE OUR PROBLEM FOR SOMEONE WHO DOES NOT HAVE A COMPUTER AND DOES NOT HAVE A FAMILY MEMBER WHO HAS A COMPUTER. THIS IS SOMETHING THAT I TALKED WITH THE MAYORS ABOUT TODAY. WE HAVE TALKED WITH LOCAL HEALTH DEPARTMENTS AND WE ARE CONTINUING TO WORK AT THE LOCAL LEVEL TO GET MORE PLEASE PLACE -- MORE PLACES WHERE PEOPLE ACTUALLY CALL THEN USE THE PHONE AND I USE THE COMPUTER. IT IS MOST EFFICIENT FOR EVERYONE BUT IF YOU DON’T HAVE A COMPUTER, DON’T USE A COMPUTER, WE WANT
Interactive map: Ohio's COVID-19 advisory system
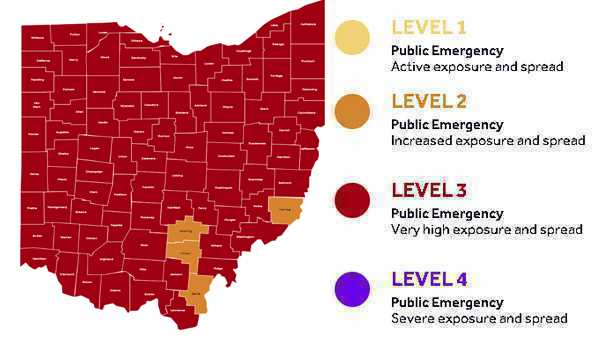
Ohio's COVID-19 advisory system remains unchanged Thursday, as the state sees a decreasing amount of COVID-19 cases and hospitalizations.All counties remain in the red, with the exception of Hocking, Galia, Monroe and Vinton counties. The red category means the county has triggered four or five of the seven indicators, and there is very high exposure and spread.Below is an interactive map showing where each county stands. The below map is accurate as of Feb. 4.CAN'T SEE THE MAP BELOW? CLICK HERE. PGRpdiBjbGFzcz0iaW5mb2dyYW0tZW1iZWQiIGRhdGEtaWQ9Il8vNXo0dVRnR01JVnltRm9FT1lPb3IiIGRhdGEtdHlwZT0iaW50ZXJhY3RpdmUiIGRhdGEtdGl0bGU9Ik9oaW8gQ09WSUQxOSBBZHZpc29yeSBTeXN0ZW0iPjwvZGl2PjxzY3JpcHQ+IWZ1bmN0aW9uKGUsaSxuLHMpe3ZhciB0PSJJbmZvZ3JhbUVtYmVkcyIsZD1lLmdldEVsZW1lbnRzQnlUYWdOYW1lKCJzY3JpcHQiKVswXTtpZih3aW5kb3dbdF0mJndpbmRvd1t0XS5pbml0aWFsaXplZCl3aW5kb3dbdF0ucHJvY2VzcyYmd2luZG93W3RdLnByb2Nlc3MoKTtlbHNlIGlmKCFlLmdldEVsZW1lbnRCeUlkKG4pKXt2YXIgbz1lLmNyZWF0ZUVsZW1lbnQoInNjcmlwdCIpO28uYXN5bmM9MSxvLmlkPW4sby5zcmM9Imh0dHBzOi8vZS5pbmZvZ3JhbS5jb20vanMvZGlzdC9lbWJlZC1sb2FkZXItbWluLmpzIixkLnBhcmVudE5vZGUuaW5zZXJ0QmVmb3JlKG8sZCl9fShkb2N1bWVudCwwLCJpbmZvZ3JhbS1hc3luYyIpOzwvc2NyaXB0Pg==YELLOW: ALERT LEVEL 1: A county has triggered zero or one of the seven indicators, and there is active exposure and spread.ORANGE: ALERT LEVEL 2: A county has triggered two or three of the seven indicators, and there is increased risk of exposure and spread.RED: ALERT LEVEL 3: A county has triggered four or five of the seven indicators, and there is very high exposure and spread.PURPLE: ALERT LEVEL 4: A county has triggered six to seven of the indicators, and there is severe exposure and spread. Stay home as much as possible. There are seven different data indicators to determine the four levels, state officials said. Each data indicator helps identify the risk factor for each county. Those seven factors are as follows:NEW CASES PER CAPITA: When the data shows that a county has had an average of 50 cases per 100,000 people over a two-week period, that triggers a flag for an increasing case rate. Using this data means we are taking into account the population of a county when monitoring case increasesSUSTAINED INCREASE IN NEW CASES: If the number of new cases in a county continually increases, that’s another indicator of virus spread. A county will be flagged for meeting this indicator if the data shows at least a five-day period of sustained new case growth.PROPORTION OF CASES NOT CONGREGATE CASES: Data showing more than 50% of new cases originating from non-congregate settings during at least one of the past three weeks will trigger a flag on this indicator.SUSTAINED INCREASE IN ER VISITS: ER data will show us the trend in the number of people who visit an emergency department with COVID-19 symptoms or a COVID-19 diagnosis as a result of the visit. A county is flagged when there is an increase in such ER visits over a five-day period.SUSTAINED INCREASE IN OUTPATIENT VISITS: This data set looks at the number of people visiting outpatient settings, including telehealth appointments, with suspected or confirmed COVID-19 symptoms. A county is flagged when there is an increase over a five-day period.SUSTAINED INCREASE IN NEW COVID-19 HOSPITAL ADMISSIONS: When the numbers show at least a five-day period of sustained growth in the number of county residents with COVID-19 who are admitted to a hospital, the county will be flagged for meeting this indicator.ICU BED OCCUPANCY: This indicator looks at regional data for both COVID-19 and non-COVID-19 use of ICU beds. A county is flagged for this indicator when the regional ICU occupancy goes above 80% for at least three of the last seven days.
Ohio's COVID-19 advisory system remains unchanged Thursday, as the state sees a decreasing amount of COVID-19 cases and hospitalizations.
All counties remain in the red, with the exception of Hocking, Galia, Monroe and Vinton counties. The red category means the county has triggered four or five of the seven indicators, and there is very high exposure and spread.
Below is an interactive map showing where each county stands. The below map is accurate as of Feb. 4.
CAN'T SEE THE MAP BELOW? CLICK HERE.
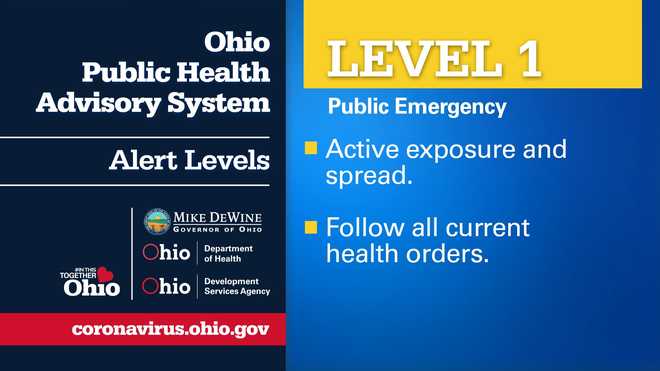
YELLOW: ALERT LEVEL 1: A county has triggered zero or one of the seven indicators, and there is active exposure and spread.
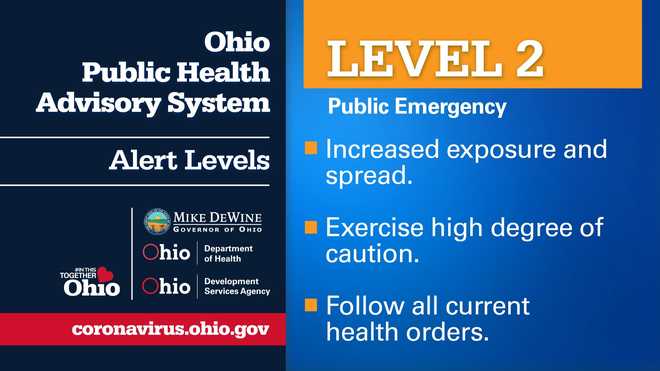
ORANGE: ALERT LEVEL 2: A county has triggered two or three of the seven indicators, and there is increased risk of exposure and spread.
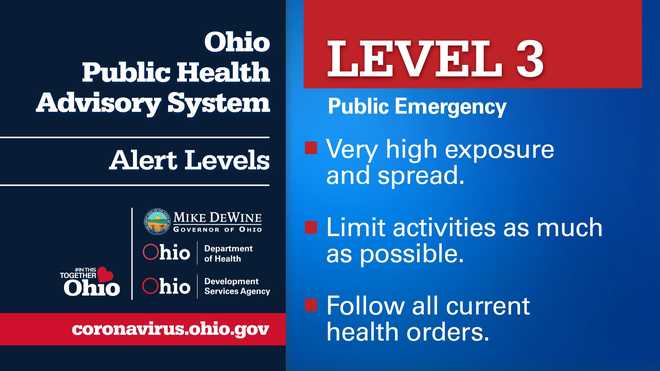
RED: ALERT LEVEL 3: A county has triggered four or five of the seven indicators, and there is very high exposure and spread.
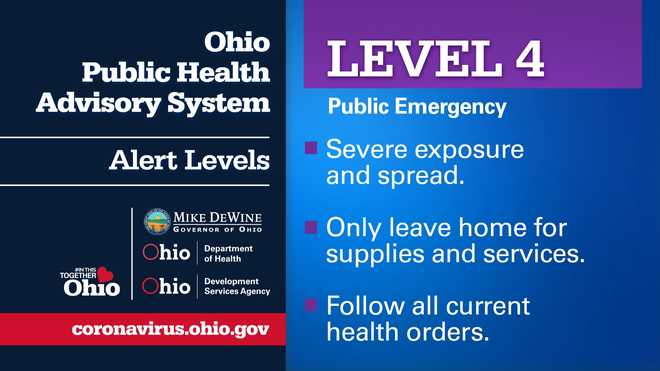
PURPLE: ALERT LEVEL 4: A county has triggered six to seven of the indicators, and there is severe exposure and spread. Stay home as much as possible.
There are seven different data indicators to determine the four levels, state officials said. Each data indicator helps identify the risk factor for each county. Those seven factors are as follows:
- NEW CASES PER CAPITA: When the data shows that a county has had an average of 50 cases per 100,000 people over a two-week period, that triggers a flag for an increasing case rate. Using this data means we are taking into account the population of a county when monitoring case increases
- SUSTAINED INCREASE IN NEW CASES: If the number of new cases in a county continually increases, that’s another indicator of virus spread. A county will be flagged for meeting this indicator if the data shows at least a five-day period of sustained new case growth.
- PROPORTION OF CASES NOT CONGREGATE CASES: Data showing more than 50% of new cases originating from non-congregate settings during at least one of the past three weeks will trigger a flag on this indicator.
- SUSTAINED INCREASE IN ER VISITS: ER data will show us the trend in the number of people who visit an emergency department with COVID-19 symptoms or a COVID-19 diagnosis as a result of the visit. A county is flagged when there is an increase in such ER visits over a five-day period.
- SUSTAINED INCREASE IN OUTPATIENT VISITS: This data set looks at the number of people visiting outpatient settings, including telehealth appointments, with suspected or confirmed COVID-19 symptoms. A county is flagged when there is an increase over a five-day period.
- SUSTAINED INCREASE IN NEW COVID-19 HOSPITAL ADMISSIONS: When the numbers show at least a five-day period of sustained growth in the number of county residents with COVID-19 who are admitted to a hospital, the county will be flagged for meeting this indicator.
- ICU BED OCCUPANCY: This indicator looks at regional data for both COVID-19 and non-COVID-19 use of ICU beds. A county is flagged for this indicator when the regional ICU occupancy goes above 80% for at least three of the last seven days.
Source link


